Histogram
Analogy Description
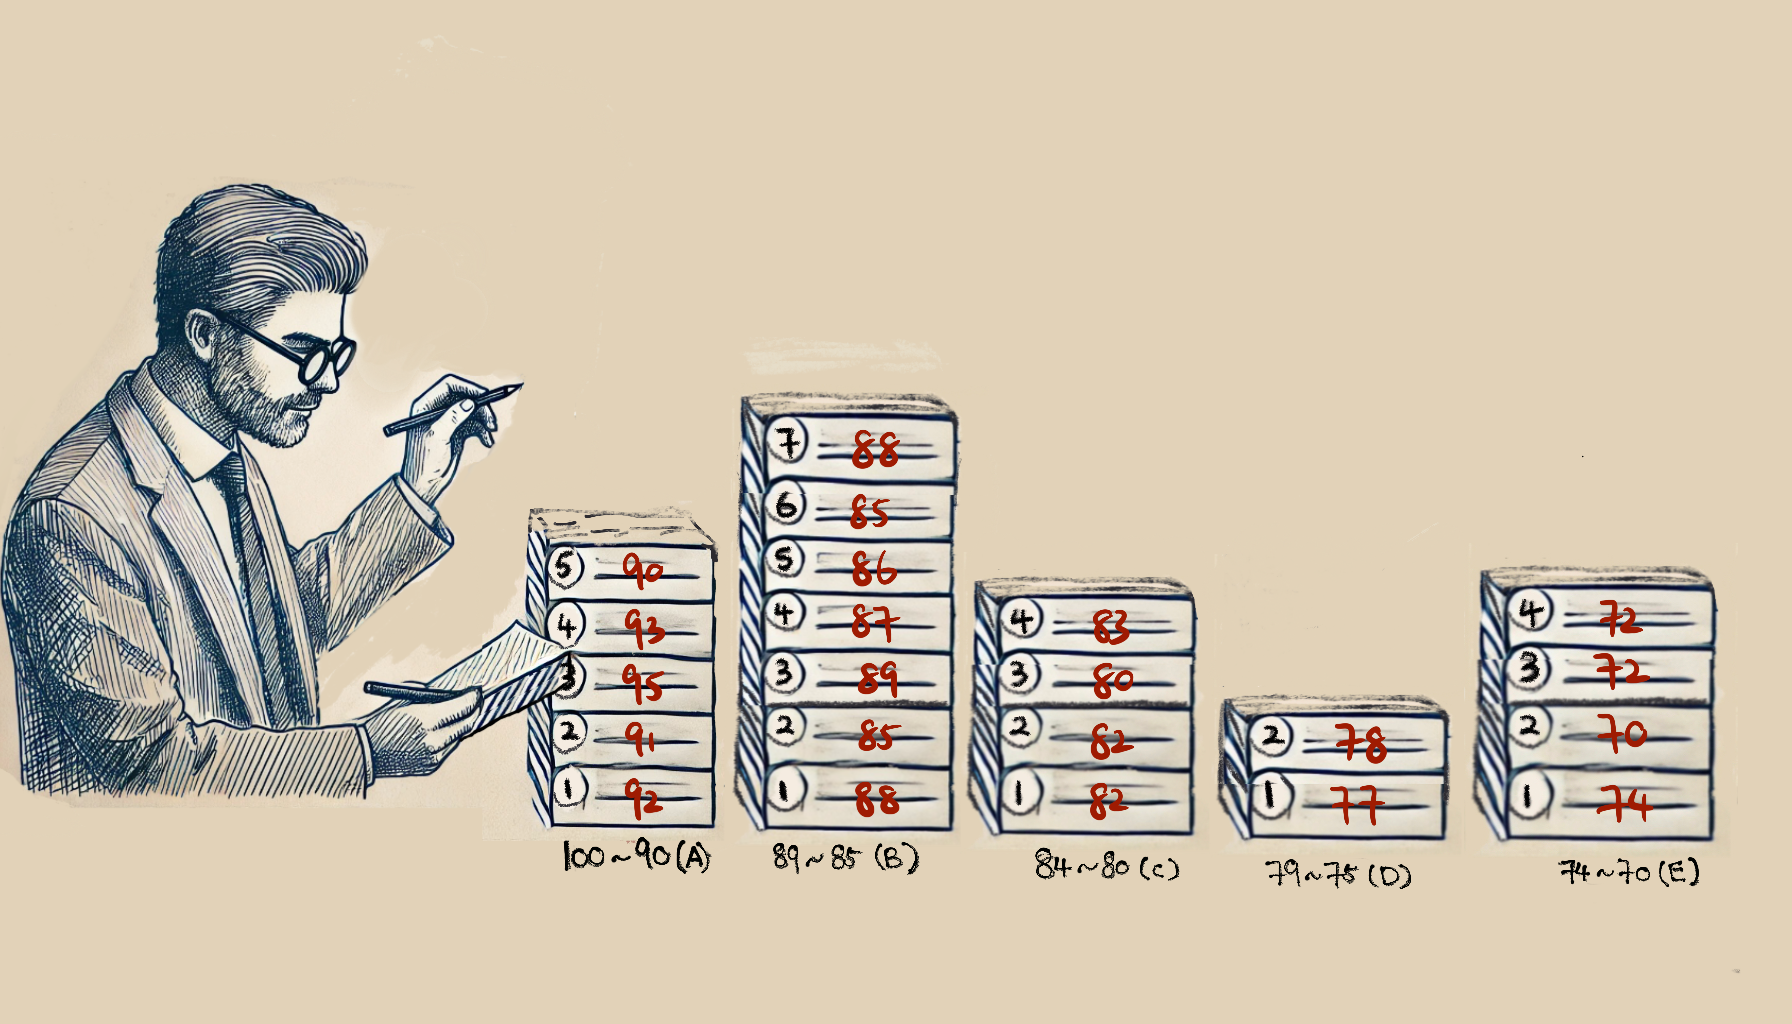
Imagine a teacher standing at the front of the classroom, distributing worksheet booklets to students. Each stack of booklets represents a score range, showing how many students scored within that bracket. This visual representation of stacked booklets is akin to a Histogram.
Stacking Up the Scores
In a Histogram, each bar corresponds to a range of values (like a grade range), and its height or size indicates how many items (students) fall into that range. Here, each stack of booklets is a bar, showing you at a glance which ranges have the most or fewest scores.
Sorting the Class
Picture the teacher flipping through every test, placing each one in the appropriate stack based on its score. By the end, each score range has a “pile” of tests that reveal its frequency. In other words, the taller the pile, the more students scored in that bracket.
Identifying Trends
When you see these stacked booklets (bars) lined up, you can easily spot which score ranges are most common. This is exactly how a Histogram works in data analysis: it helps you identify patterns or concentrations of values across various ranges with just one glance.
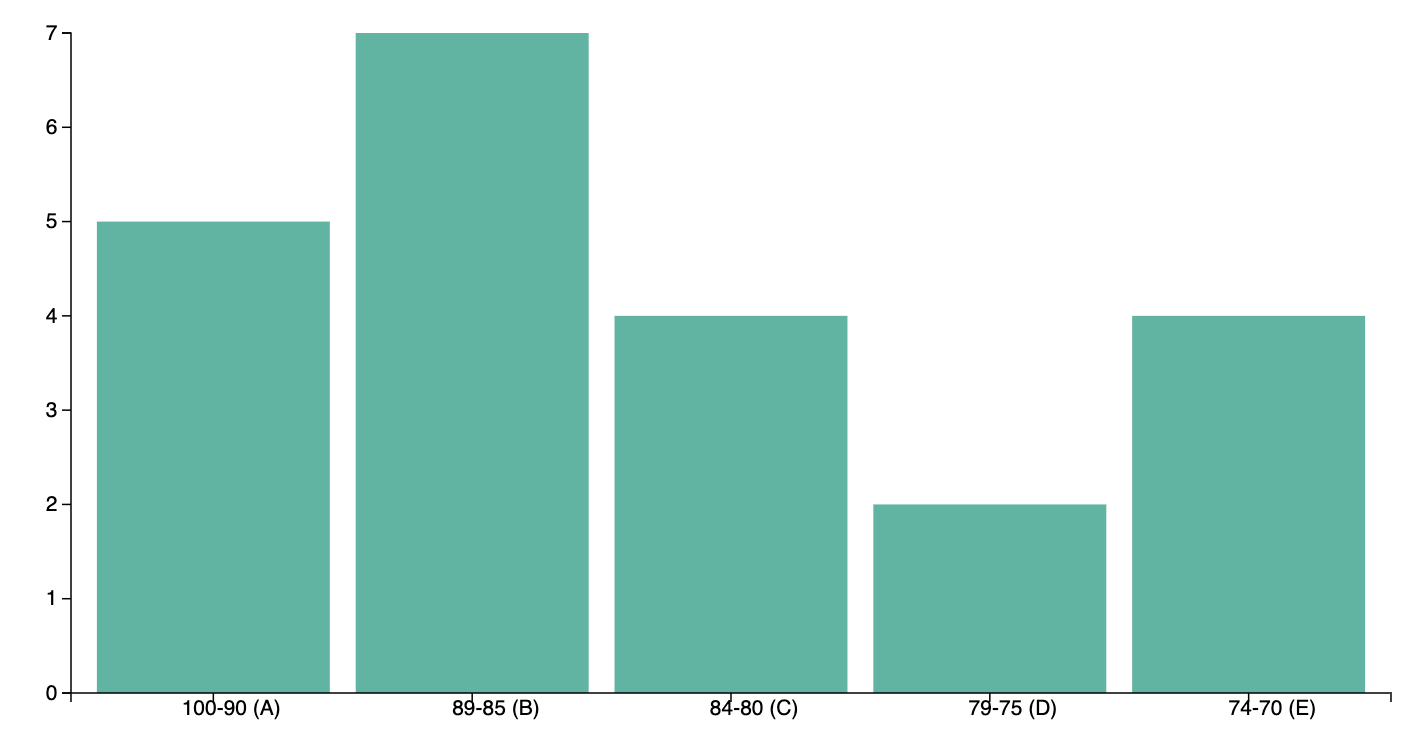
Chart Data (Read-Only)
Visualization Analogy
Actual Chart