Waterfall
Analogy Description
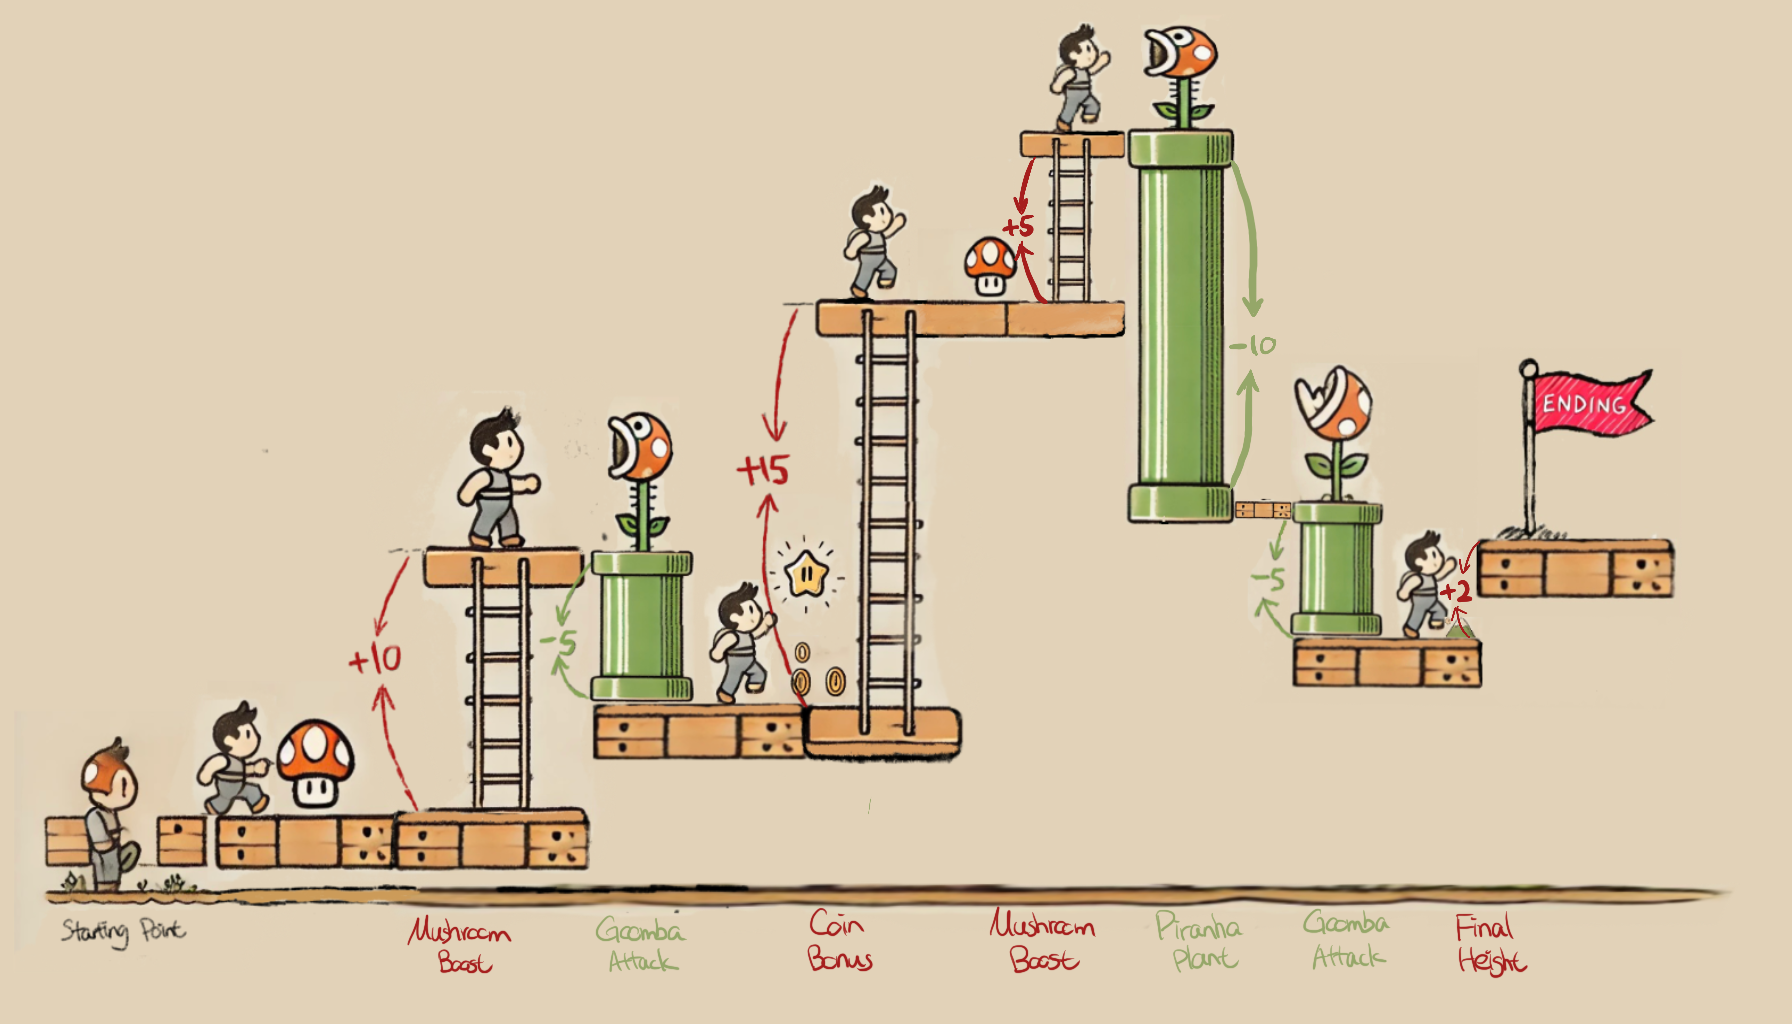
Imagine you are flipping through a photo album of Mario's journey, where each picture captures a moment when he gains or loses height. A Waterfall Chart shows Mario’s progress step by step, illustrating how each platform move contributes to his ascent toward the top of a mountain.
Mario’s Photo Album
For each stage of Mario’s climb, revealing whether he lands on a platform that boosts him higher (positive height) or causes him to fall (negative height). Think of it like snapshots in time, where you can see his altitude change at every turn.
Gains and Losses
In the Waterfall Chart, each bar appears one after another, similar to flipping a page in the album. An upward bar symbolizes a power-up or successful jump (gain in height), while a downward bar represents a slip or an enemy encounter (loss in height).
Reaching the Summit
By the end of this photo album, you see Mario standing triumphant on the highest platform, reflecting how each of his positive and negative stages add up. The final bar in a Waterfall Chart displays the net total, revealing the ultimate height Mario gains after all the ups and downs of his adventure.
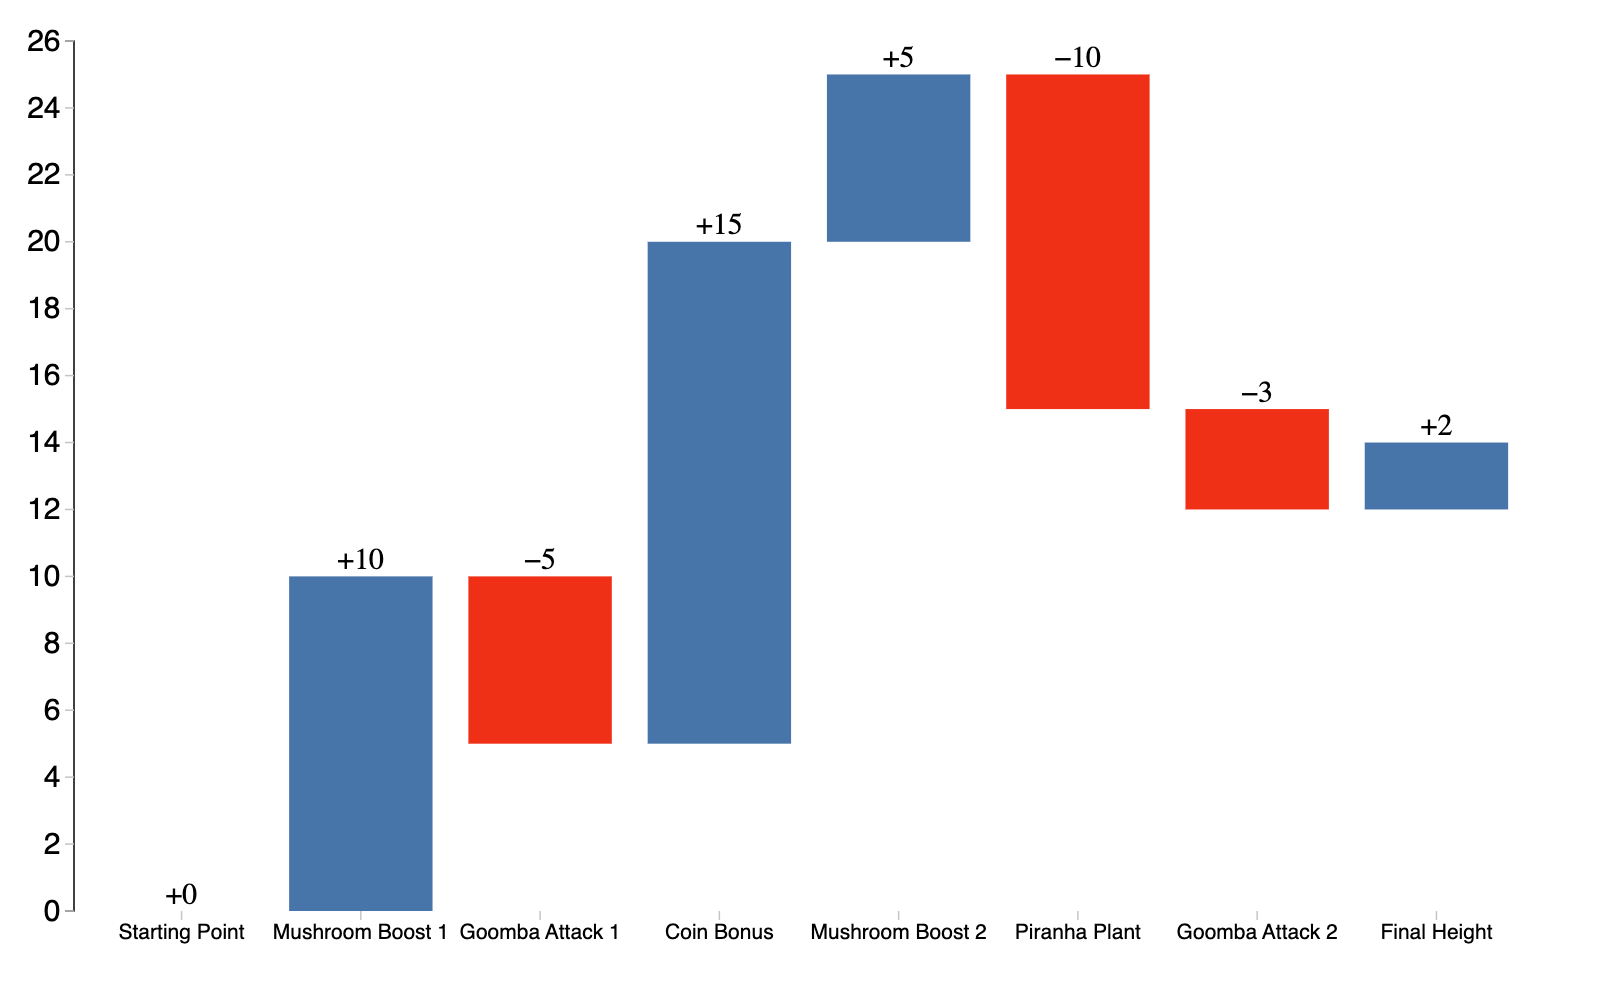
Chart Data (Read-Only)
Visualization Analogy
Actual Chart